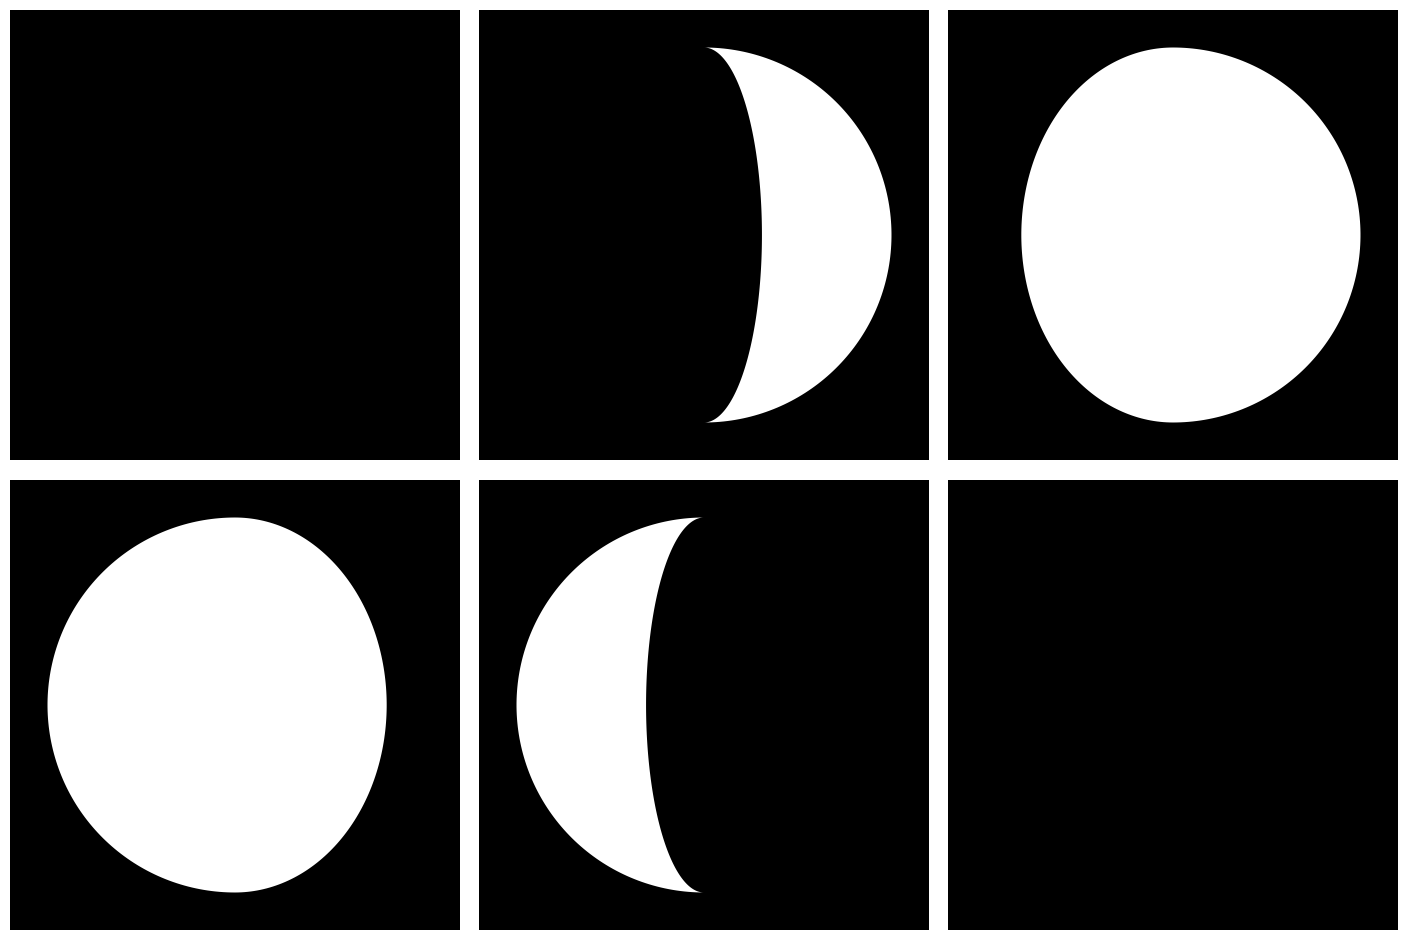
The appearance of the Moon changes once every month in a cycle known as lunar phases. At any given time half of the Moon is illuminated by the Sun and the other half is dark. The phases occur because we see different amounts of the illuminated and dark halves as the Moon orbits the Earth. For example, during a crescent moon we see a small amount of the illuminated half and most of the dark half, whereas during a full moon we see all of the illuminated half and none of the dark half.
Even though the Moon is a sphere, it appears as a flat object to the naked eye because it is so far away from the Earth. Galileo Galilei was one of the first people to look at the Moon through a telescope in the early 1600s. He saw craters and mountains, demonstrating that the Moon is a world with complex geography. Today we know a great deal about the Moon thanks to the astronauts and robotic spacecraft that have traveled there.
A Python program approximates the appearance of the lunar phases by treating the illuminated portion of the Moon as a three dimensional, spherical surface and then projecting the shape onto a two dimensional image. This is similar to how maps of the Earth are made. The mathematics involved are fairly straightforward combinations of sine and cosine functions.
The Python code is available on GitHub.